vision-research.eu - The Gateway to European Vision Research
![]()

![]()
You are here: vision-research.eu » Vision Research » Visionary of the Quarter » Leopold Schmetterer (Q02-2011)
Major Topics Of Our Research Work

In the recent years major developments in imaging ocular structures have been achieved. Optical coherence tomography (OCT) has become the most important tool in imaging the retina and plays a key role in diagnostics and treatment control. OCT has also become essential in imaging the anterior segment and the optic nerve head (ONH). In the recent years we focused on the development of functional extensions of OCT. While conventional OCT aims to visualize anatomical structures, functional OCT aims to extract additional parameters such as blood flow or oxygenation.
Functional OCT
Approximately 10 years ago time domain OCT has been extended by measuring Doppler shifts in the re-emitted signal in order to gain insight into blood velocities in human retinal vessels. Nowadays time domain OCT was replaced by Fourier domain OCT (FDOCT) providing significantly improved signal quality. With this technique no translation of the reference mirror is required. Instead, the re-emitted light is directed towards a diffraction grating and then directed towards a CCD camera. We have extended this technique for the measurement of velocity profiles in retinal vessels (Fourier Domain Optical Doppler Tomography, FDODT). The basic relation in FDOCT is that the amplitude of the backscattered wave equals the Fourier transform of the scattering potential of the object. The inverse Fourier transform yields the autocorrelation of the object function. In order to measure velocities one needs to calculate the phase difference at the same point between two consecutive measurements after Fourier transform. Since one has only access to phase changes along the incident beam, the tilting angle α between incident beam and flow velocity vector needs to take into account.
 |
 |
 |
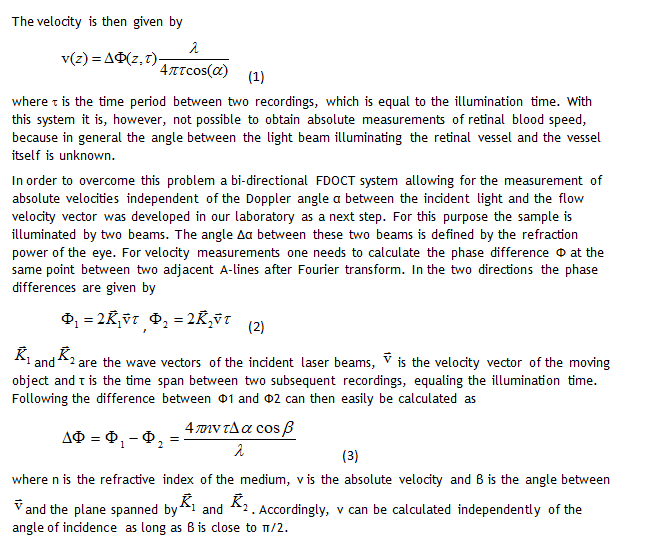
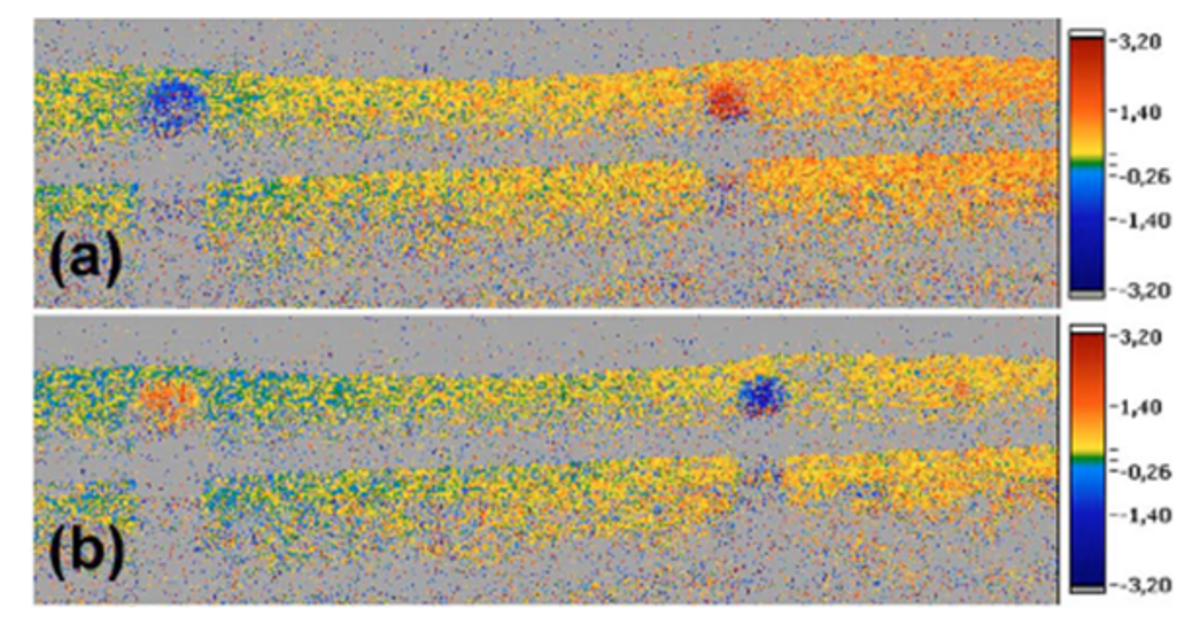
Figure 1: Phase tomograms of the human retina in vivo and extraction of absolute blood velocities in retinal vessels (for details see text, from Werkmeister et al. Opt Let 2008;33:2967-2969).
Figure 1(a) and (b) show the phase tomograms for the two polarization channels. The different angle of incidence of the two probe beams leads to opposite phase shifts for the same vessel in the two channels, as can be seen in the tomograms. In Figure 1(c) and (d) an average profile of 5 tomograms is plotted. Calculations from equation (3) yield maximum flow velocities of 2.2 cm/s and 3.1 cm/s, respectively.
The question of ocular blood flow in glaucoma
Ocular perfusion abnormalities have been hypothesized to be related to glaucoma a long time ago. Nevertheless the evidence from large-scale clinical outcome studies or population based studies is weak. However, large scale studies have shown that reduced ocular perfusion pressure is an independent risk factor for the prevalence, the incidence and the progression of the disease. Whether this means that reduced blood flow itself is a risk factor is much less established. The absence of data from large scale trials measuring volumetric retinal blood flow instead of only assessing certain aspects of ocular perfusion such as retinal vessel diameter is mainly attributable to the technical difficulties in measuring retinal blood flow. The currently available technology is time consuming, requires specifically trained personal and often provides poor reproducibility. Bi-directional FDODT as described in the previous paragraphs is a promising tool to get more insight into this question.
In the recent years we have gained some insight into the complex relation of ocular blood flow and ocular perfusion pressure. Figure 2 shows the theoretical behavior of ocular blood flow during changes in perfusion pressure.
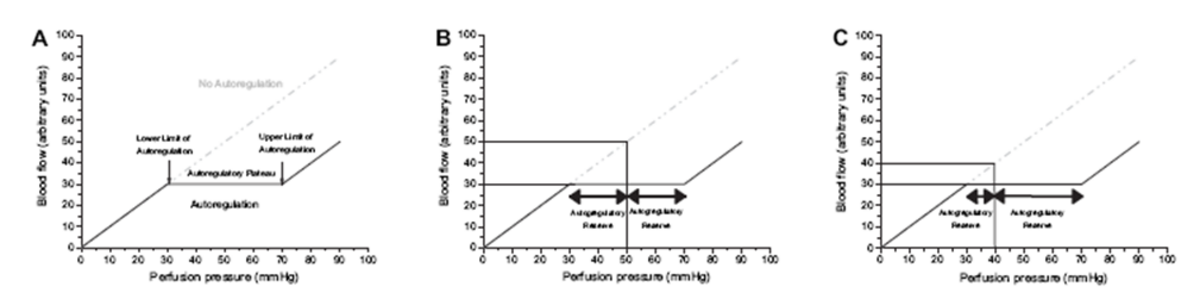
Figure 2. - Panel A:
Theoretical behavior of blood flow in an autoregulated and a non-autoregulated vascular bed, respecetively. In the autoregulated vascular bed perfusion pressure (in this case from 30 mmHg to 70 mmHg) can be varied without changes in blood flow. Accordingly, the autoregulatory range is 40 mmHg, and the upper and lower limits of autoregulation are 70 mmHg and 30 mmHg, respectively.
Figure 2. - Panel B:
At a level of 50 mmHg blood flow in the non-autoregulated vascular bed is 50 a.u., in the autoregulated vascular bed 30 a.u. In the latter case the autoregulatory range towards low perfusion pressure is 20 mmHg, as is the autoregulatory range towards high perfusion pressure.
Figure 2. - Panel C:
In the case of low perfusion pressure, which is a risk factor for glaucoma, the blood flow is lower than in the case presented in Panel B when autoregulation is absent (40 a.u.), but not in an autoregulated vascular bed (30 a.u.). When autoregulation is present the autoregulatory range towards low perfusion pressure is, however, decreased to 10 mmHg, whereas the autoregulatory range towards high perfusion pressure is increased to 30 mmHg. This is well compatible with the observation that glaucoma is associated with low perfusion pressure, high fluctuations of perfusion pressure and abnormal autoregulation (from Schmidl et al. Exp Eye Res 2011 in press).
Recently we have shown that choroidal blood flow is less well regulated when intraocular pressure is increased leading to a decrease in ocular perfusion pressure than during an increase in blood pressure (Figure 3). Our results may be relevant with regard to the discussion of ocular blood flow in glaucoma, because they indicate that in the choroid blood, flow is more dependent on intraocular pressure than on blood pressure. Hence patients with glaucoma who have comparable ocular perfusion pressure may still have different blood flow levels based on their absolute value of intraocular pressure. This result may be important in linking the pressure theory and the vascular theory of glaucoma etiology.
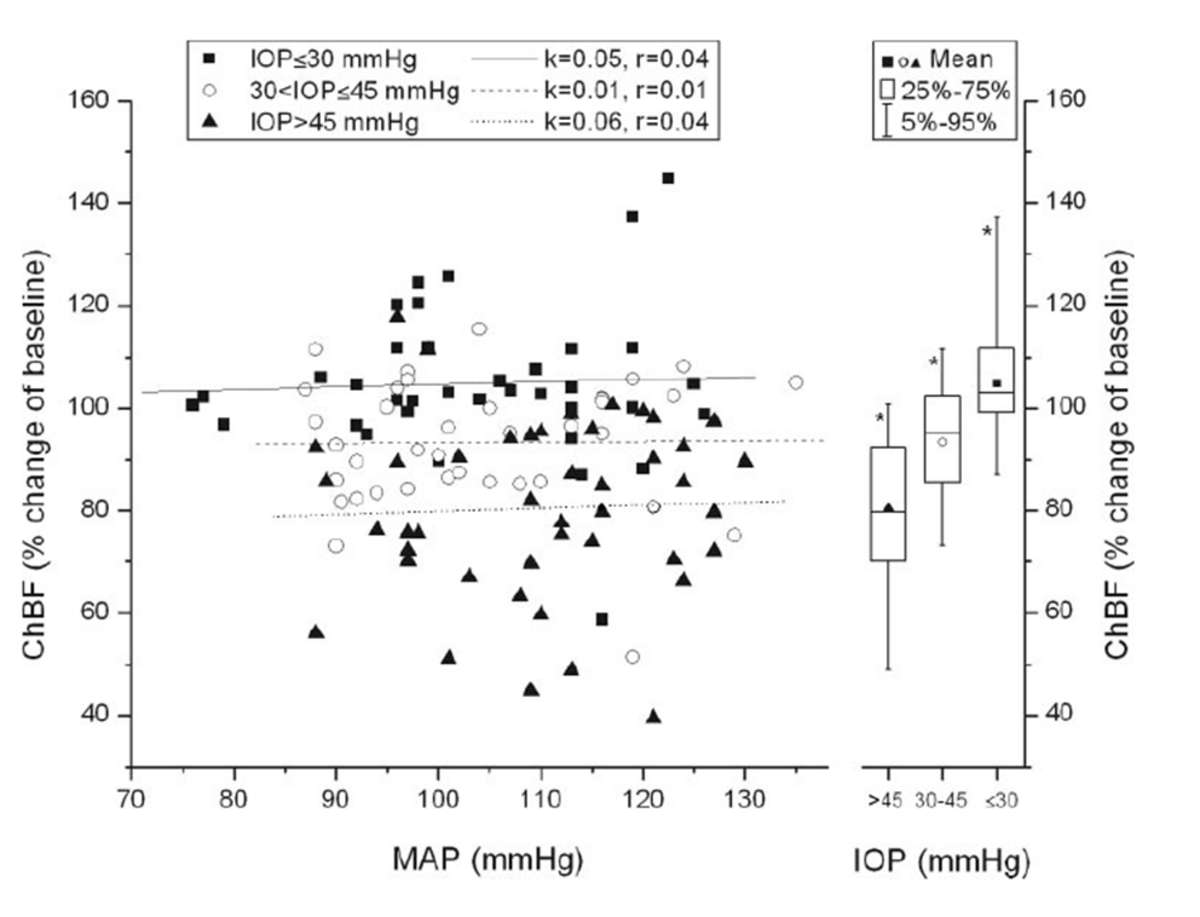 |
Figure 3:
Mean arterial pressure–Choroidal blood flow relationship during combined experimental intraocular pressure increase and isometric exercise using the categorized data according to intraocular pressre (day 1). All mean arterial pressure and choroidal blood flow pairs, except baseline, were sorted into three groups according to intraocular pressure (group 1: intraocular pressure ≤ 30 mm Hg; group 2: 30 < intraocular pressure ≤ 45 mm Hg; group 3: intraocular pressure > 45 mm Hg). Left: regression analysis for each group, performed separately. Right: box-and-whisker plots, indicating mean Choroidal blood flow at different intraocular pressures independent of mean arterial pressure. *Significant differences between these groups. k, slope of the regression line; r, correlation coefficient (from Polska et al. 2007 Invest Ophthalmol Vis Sci 2007;48:3768-3774).
Dr. Leopold Schmetterer
Medical University of Vienna
Vienna, Austria